In Part 1 of this case study, we shared with you how we built a system for affordable housing developer BRIDGE Housing that tracks complex funding compliance requirements and boils them down to helpful visual indicators.
Today we expand on that story and share how we replaced a paper-based class attendance system with a tablet-based online attendance process built on Salesforce Sites.
Challenges: Cumbersome attendance tracking and limited metrics
Until recently, all BRIDGE programming providers took attendance with paper and pen. After attendance sheets were passed around and filled in, staff back in the office had to decipher the hand-written names and unit numbers and enter them into a spreadsheet. The spreadsheet was in turn processed against BRIDGE’s tenant management database, a product called Yardi, to match to a tenant code and attempt to distill some meaningful metrics about tenant attendance at programming. However, there was no central database to easily store and cross-reference this data, so there were many metrics BRIDGE wanted to be able to report that they simply couldn’t derive from their data, such as a simple count of unique participants.
Step 1: Integrate YARDI tenant data with Salesforce
The first step to tracking attendance more meaningfully was to get the resident data itself into Salesforce. BRIDGE uses YARDI, a separate tenant management database that the Programs department was able to integrate with.
We used dbAmp to schedule a nightly data transfer between Salesforce and BRIDGE’s on-premise data warehouse (which contains residency information from their property management system, YARDI). All tenants come over to Salesforce as Contacts, linking them to their units, buildings, and properties. Using a tool that integrated with BRIDGE’s existing infrastructure meant that the integration could be maintained in house comfortably by the IT team.
Step 2: Tablet-based attendance tracking
Now that tenant data was available in Salesforce, we turned our efforts to attendance data entry. We used a Flow exposed on a Force.com Site to allow teachers and other programming providers to enter attendance data on tablets right on-site.
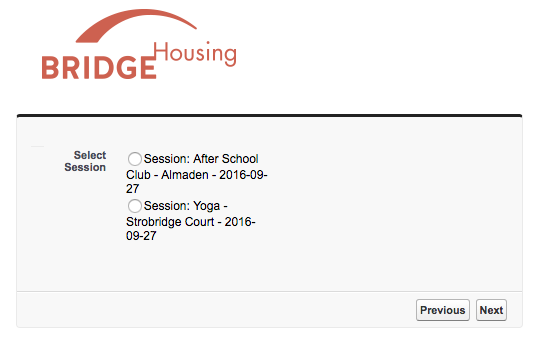
The provider is first presented with a screen of their sessions for the day. They select the correct session and then enter into attendee entry.
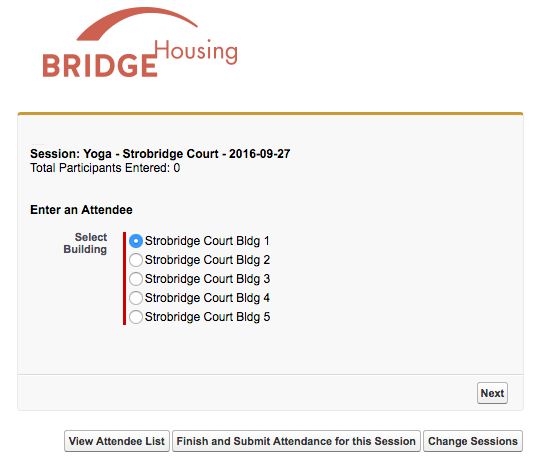
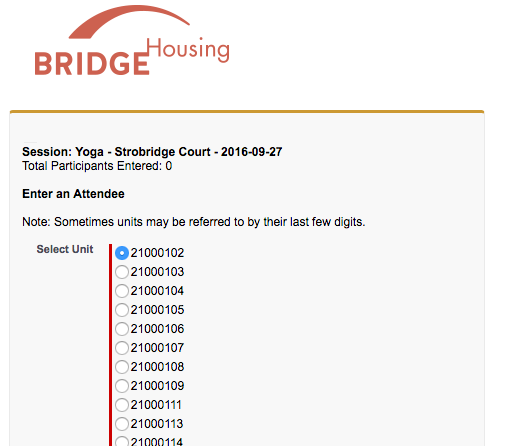
The mantra in building this workflow was “taps, not typing”. For each attendee, the provider selects the building, then the unit, and finally the tenant or tenants present from that unit. No typing necessary, and more importantly no deciphering hand-written names! Giving only providers access to this system allowed BRIDGE to balance privacy, ease of use, and accuracy. The tablets are never passed around to attendees like a sign-in sheet.
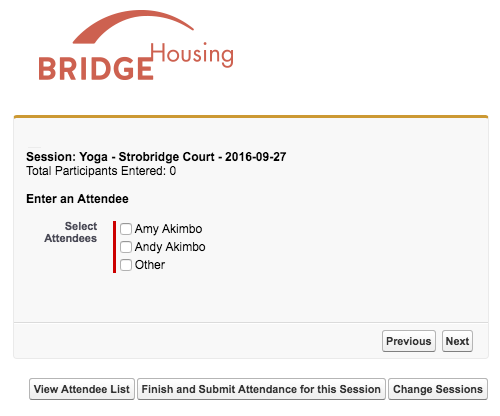
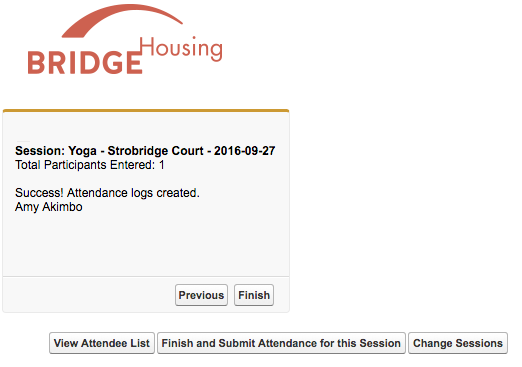
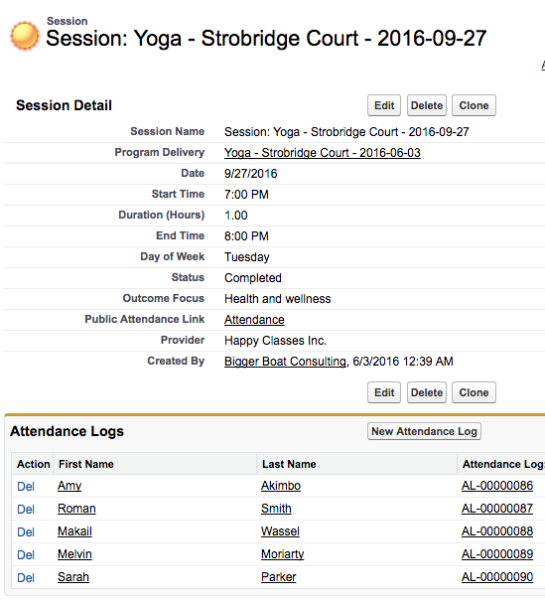
After selecting the attendee(s), the Flow creates Attendance Log records linking the Contact to the Session. (We used this clever Flow trick to act on a multi-select dynamic choice, allowing a provider to record attendance for more than one tenant from a particular unit at once.)
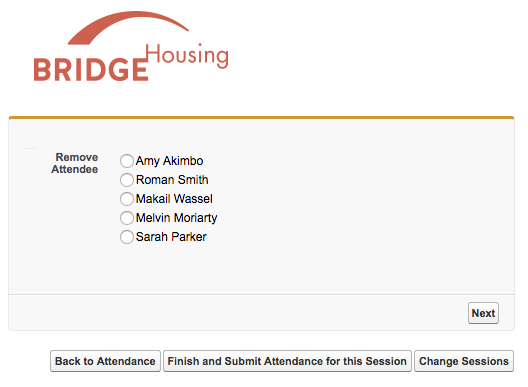
If a provider makes a mistake, they also have a page where they can remove attendees, which immediately deletes the corresponding Attendance Log.
The Flow and Sites techniques we used here are similar to the client and volunteer check-in process we built for Rainbow Center! We love leveraging out-of-the-box platform features to minimize paper-based processes!
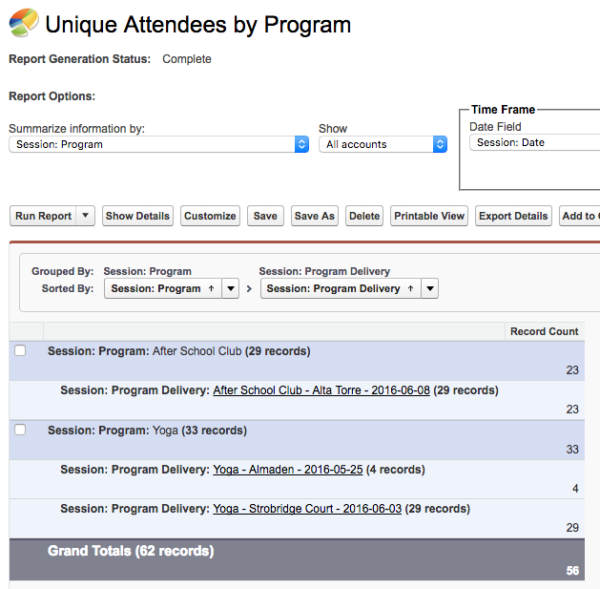
Since Attendance Logs can be summarized by Contact, BRIDGE finally has easy access to key metrics such as:
- How many unique tenants were served in a time period?
- On average, how many sessions each tenant attended in a time period?
- What percentage of tenants attended at least one session in a time period, broken down by property?
Summary
With just a few lines of Visualforce to embed the Flow in a Site, we have a tablet-based solution for third-party programming providers to directly enter attendance data from right in the room. No more paper, no more manual data entry, no more meaningless, disaggregated data! Now, the team has easy access to meaningful, real-time metrics that can help them evaluate their offerings more carefully and focus their budgets and efforts to optimize tenant outcomes.